Monday, December 22, 2014

Culture and Consumer Behaviour

Culture is the mental programming of people in a particular context. It consists of implicitly shared meanings among a group of people. McCracken (1986) defines two elements of culture as (a) Cultural categories: which are fundamental axes or lenses of meaning through which the individual divides and views the world. These categories can include distinctions of race, class, gender, etc; and (b) Cultural principles: which are the values and ideas that form the basis of the above categorization. 

Hofstede, Neuijen, Ohayv, & Sanders (1990) developed a model to classify the levels of manifestation of culture. Figure 1 depicts the model.

Figure 1. Manifestation of Culture

Symbols are explicit words, gestures, pictures, objects that carry a specific meaning within a culture. Heroes are real or fictitious characters who personify prized characteristics in the culture. Rituals are activities conducted periodically which are socially essential within a culture. All these elements are explicit and can be observed in cultural practices. The deepest level of culture lies in values. Value can be defined as the answer to the question, “What is it that you want to live for? How do you want to live?” Hence, values are the end goals and preferred mode of action that people want to pursue.
McCracken (1986) also elucidates that cultural meanings are located in and transfer between three places namely, the culturally constituted world, the consumer good, and the individual consumer. Hence, in order to build cultural resonance, brands need to decode culture from the target society and encode culture in their brands through their products and advertisements.

Surf Excel: Redefining Cultural Principles

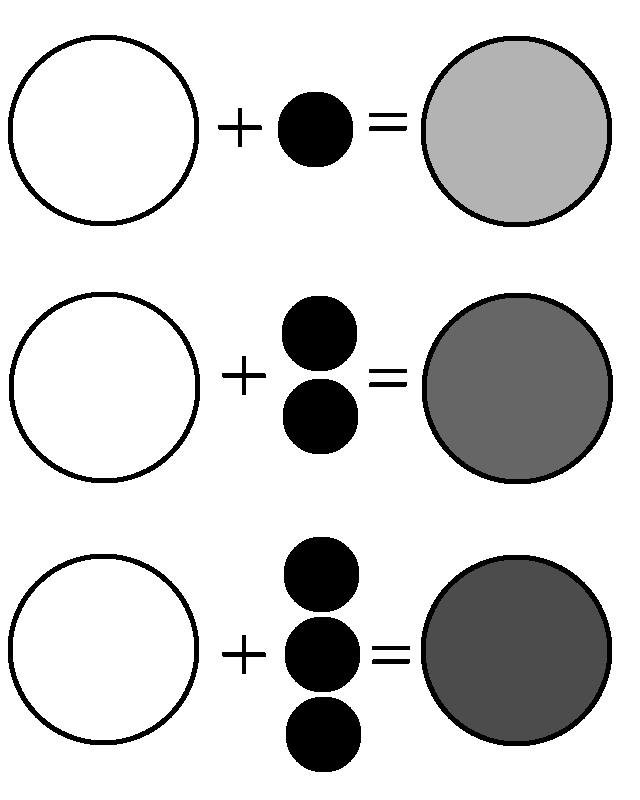
Cultural principles define cultural categories into valences and hierarchies. They decide what is good and what is bad. The detergent category conventionally follows the principle of ‘dirt is bad’, with all brands positioned on cleanliness and whiteness. Surf Excel redefined this cultural principle in order to break the clutter in the market and positioned itself on ‘dirt is good’.


Figure2. Surf Excel - Shifting Cultural Category by changing Cultural Principles
In Asia, dirt is culturally associated with negative aspects of poverty, poor hygiene, hardship, disease and sometimes death. In a case study written by Unilever and their advertising agency, Lowe (Gosling & Jathanna, 2012), they explain that they reversed the logic of making dirt ‘good’ from bad among moms by showing them the life values kids learn through dirt. Asian mothers cherish life values of  'forgiveness', 'sacrifice', 'gratitude', 'courage', 'determination' and want their child to inculcate these traditional values. Surf Excel, through its advertisements, showcased that, through dirt, a child can learn these values and have high gains. This helped Surf Excel become a symbol for freedom (Sachitanand, 2012). This campaign helped the brand's sales in Asia grow tenfold and become the No.1 brand in most Asian countries, with market share reaching as high as 70% (Gosling & Jathanna, 2012).


Fair & Lovely: Tapping the Values of Fairness

Fair & Lovely is the largest selling skin whitening cream in the world. It was launched by Unilever first in the Indian market. It held a leadership market share of 50-70% of the skin whitening market in India in 2006, with its close rivals Fairever and FairGlow only having a combined share of 16% (Karnani, 2007). Fair & Lovely was able to build resonance with Indian consumers because it decoded the culture of fairness at a deeper level of values and encoded the same in its brand communication.

Based on the cultural analysis done by Verma (2011), we can plot the manifestation of the Culture of Fairness of Hofstede’s model as follows:


Symbols
·         Hindi idioms 2 (‘kali kartutein’, ‘kala akshar..’ ‘Buri nazar wale..’ ‘kaali kaluti baigan looti’
·         Moon related songs (lullaby and film songs) ‘chand see mehbooba ho..’
·         Fairness eulogizing popular songs and folk songs

Heroes
·         Snow White, Cinderella, Sleeping Beauty, Fair protagonist in movies

Rituals
·         Home treatments to protect fairness
·         Religious customs of worshipping ‘full moon’ (poornima, poonam) vs. amavasya,
·         Search for bride and bridegroom (matrimonial ads) Eg: "I am a 36-year-old man looking for an ideal Indian wife. She must be beautiful, fair skinned, well-mannered and respectful of my aging parents."

Values
·         Feminine beauty, perfection, racial superiority, confident, attractive
·         Better marital and job prospects, status


Fair & Lovely tapped into the deep values associated with fair skin and showcased the same in their advertisements. They initially positioned the fairness cream as an instrument to reach the end goal of better marital prospects. As the society changed towards increasing career consciousness among women, they moved to the end value of better job prospects and focused on the role of the product in helping the women realize their dream of becoming independent.

Clottaire Rapaille – Unlocking the Culture Code for Product Design

The deepest manifestation of culture lies in values. However, consumers may not be consciously aware of their own value systems that drive their behaviour and decisions. Most of the deepest held values are at sub-conscious level. Clottaire Rapaille is a psychologist who delves into the sub-conscious mind of consumers to uncover culture codes associated with product categories. In his book “The Culture Code” (Rapaille, 2006), he explains that the culture code can be decoded by analysing childhood imprints.

He presents an example of Wrangler Jeep, a player in the American SUV market. Jeep Wrangler was initially a big player, but later lost ground because of many new entrants in the SUV segment offering higher comfort and luxury. Chrysler, the manufacturer, was contemplating to redesign the Wrangler Jeep to make it more comfortable and luxurious. However, Rapaille’s research probed on the childhood imprints of “Jeep” among American consumers and found stories about free riding in open planes and symbols of the American West. He concluded that the Code for Jeep in America is HORSE. He recommended to design the product to symbolize a horse. A horse is not associated with comfort or luxury. It is associated with toughness and ruggedness. Hence, Jeep was designed with removal doors and an open top – to give the feeling of wind while riding, similar to riding a horse. They included tough leather like a saddle for the seats and made the headlights round in shape because horses have round eyes and not square ones.

The company also used a horse in its advertising and presented the Wrangler as a noble, nomadic hero that arrived serendipitously in perilous situations, resolved them thanklessly, and rode off quietly into the sunset. With the new product design, the sales of Jeep grew substantially along with establishment of Jeep fan clubs in America. These fan clubs also had t-shirts with the slogan “Real Jeeps have round headlights.” Recently, I-Phone cases with the Jeep theme are also being sold (See image). The brand has become a symbol for wildness and ruggedness and has strong resonance among its consumers.

Figure 4. I-phone case with Jeep theme

Figure 5. Recent T-shirt themes on Jeep

References:
Gosling, B., & Jathanna, R. (2012). OMO/Surf Excel/Rinso/Breeze: Dirt is good - The value of dirt. Warc Prize for Asian Strategy.
Hofstede, G., Neuijen, B., Ohayv, D. D., & Sanders, G. (1990). Measuring Organizational Cultures: A Qualitative and Quantitative Study Across Twenty Cases. Administrative Science Quarterly, 35(2), 286. doi:10.2307/2393392
Karnani, A. G. (2007). Doing Well By Doing Good - Case Study: “Fair & Lovely” Whitening Cream (SSRN Scholarly Paper No. ID 958087). Rochester, NY: Social Science Research Network. Retrieved from http://papers.ssrn.com/abstract=958087
McCracken, G. (1986). Culture and Consumption: A Theoretical Account of the Structure and Movement of the Cultural Meaning of Consumer Goods. Journal of Consumer Research, 13(1), 71–84.
Rapaille, C. (2006). The culture code : an ingenious way to understand why people around the world buy and live as they do / Clotaire Rapaille. New York : Broadway Books, c2006.
Sachitanand, R. (2012, August 8). How HUL succeeded in breaking through the clutter with “Surf Excel” campaign. The Economic Times.
Verma, H. V. (2011). Skin “Fairness”—Culturally Embedded Meaning and Branding Implications. Global Business Review, 12(2), 193–211. doi:10.1177/097215091101200202

Friday, July 4, 2014

Calculating 50 Shades of Grey

The Mathematics of Social Sciences


As I enter my journey at IIMB as a PhD candidate in marketing, I see myself as a social scientist. I see myself as an explorer and investigator of the human mind and behavior. I see myself applying principles of psychology, sociology and anthropology - the beautiful 'soft' sciences of mankind. But suddenly, my vehicle of learning takes a sharp detour into the 'hard' science of mathematics.

Over the last 3 weeks, I have been exposed to a lot of mathematics - a lot and of a different breed. I have been exposed to a lot of concepts whose existence I was oblivious to. After keeping me away from mathematical education after class 12, life decided to finally orchestrate a rendezvous with Linear Algebra. As terms like matrices, vectors, transpose, multivariate calculus, projections, etc. were being 'bombarded' at me, a volley of questions bounced in my mind...

"Why do I need to learn all this? How is this related to my future research work? How will this help me in understanding the human mind? Isn't statistics enough to compute quantitative data? Why do we need matrix algebra here???"


For the first 2 weeks, these questions kept rotating within my mind. But as I entered the third week, consciousness dawned into me. After spending 5 hours with Gilbert Strang (I met him virtually through his book!), epiphany struck its magic wand and I realized that Linear Algebra is one of the coolest things a social scientist can learn. From that moment, I started seeing myself as a potential 'Social Mathematician' as well.

As a social scientist, I would be involved in explaining the human mind and behavior. As we all know, today's world is not a very simple place. There is nothing purely black or white. There are various shades of grey. And as we all know, grey is nothing but a linear combination of black and white.


Let's take a simple generalization of the human mind being a combination of 2 elements namely - Good & Evil. All the people in this world would have different combinations of good and evil in their minds. We can draw parallels with numerous ancient oriental philosophical concepts like Yin & Yang (Combination of 2 opposing elements) and Om (Combination of 3 elements A,U,M).


So, we can start identifying linear combinations in almost everything around us, including the human mind.

Let's go back to our basic example of linear combination of 2 basic colours - Black and White.
Now, imagine that I am mixing these 2 paints on a palette to get a resultant colour Grey. It is possible for me to mix black and white paint in different proportions to arrive at various shades of grey.


When we are given a particular shade of grey, we can find out the specific proportion of black and white that was combined to get this specific shade of grey. Since grey is a linear combination of black and white, we can express them in the form of algebraic equations where w= white, b=black and g=grey

g= xw+yb

Here, x & y are the proportional weights of white & black respectively.
For different values of x & y, I will get different shades of grey.


We can express this particular linear combination in the form on a matrix where the rows equate to the dimension of 'whiteness' and 'blackness' and the columns signify the actual colours:


In a scenario where I am mixing only 2 elementary colors - black and white - that are mutually independent of each other - for every shade of grey I can identify the specific combination of black and white. But there may be situations where we may not be able to arrive at a specific combination.

Situation 1 - No possible combinations!

Imagine you come across a question as absurd as, "What combination of black and white will give you RED?"


No matter what combination of black and white you mix on your palette, you will never get red. Hence, such a situation has no solution.

Situation 2 - Infinite possible combinations!

Imagine you come across a question that says, "What combination of black, white and medium grey will give you dark grey?
Here, we are combining 3 colours to get a fourth colour. But the problem is that the initial 3 colours are not mutually independent of each other. The third colour medium grey is a linear combination of the first 2 colours. In such a situation, we end up getting infinite possible combinations! 
Let's see this with a numeric illustration:

We define medium grey as lg= w+b, and dark grey as dg= w+3b, we can express this as:


As it can be seen above, we can have multiple possible combinations of the 3 colours to arrive at the fourth colour. We can either mix only white and black and none of medium grey, or take a portion of medium grey and add some more black to it to make it dark grey. If we were to include the possibility of having negative values (i.e, if it was possible to remove some colours from a mixture), we would be able to get infinite solutions!

Now, let's calculate the grey areas of human mind


Till now we looked at colours and pigments which are physical objects. But the crux of the exploration of a social scientist is human mind and behavior. So, let's apply the concept of linear combination in a human phenomena.

Let's ask a fundamental question - "What makes me content with my life?"
As a social scientist, I would think of various elements that lead to contentment in life. These elements could be having a job that you love, having a positive family life and earning handsome money.
Linear algebra comes into picture here because the level of contentment in my life would be a linear combination of these 3 elements in some proportion!

For some people, earning good money may be more important than doing something you love. Such people end up doing a job that they hate doing just because it pays them well. For some people, family happiness may be much more important than job satisfaction. Such people may end up doing something they hate just in order to keep their family happy. Instead of just guessing what element could be important in a society, we can use the magical wand of Linear Algebra to precisely find those proportions!

For illustrative purposes, let's assume that we are trying to find these proportions among a homogeneous group of 28 year old, male, graduate, working professionals in Bangalore. In order to find the combinations, we need to measure the individual elements. We can measure the following 4 questions using a 100 point scale where 0=Not at all and 100= A lot:

Q1. How content are you with your life?
Q2. How much do you like the work that you are doing?
Q3. How much higher do you think is your salary as compared to what people get at your age & experience?
Q4. How positive/ pleasant is the overall mood of your family?


We administer these questions to 3 people and their responses are as follows:

Name
Work Likeability
Paycheck Handsomeness
Family Positivity
Life Contentment
Ayush
40
50
10
27
Bharath
20
60
40
38
Chandan
60
30
50
49

As it can be seen, the data that we receive will always be in a tabular or matrix form. Each column stands for a variable captured in a question. Since we are trying to find the importance of each variable on the final variable of Life contentment, we will carry out combination of columns as follows:

On solving this system by linear algebra methods, we arrive at the solution of x=0.3, y=0.2 and z=0.5.
This gives us the solution that family positivity is given more importance, followed by work likeability and paycheck.

With the help of linear algebra, we can find out what is the main driver of contentment. Similarly, this tool can be applied in calculating any other measurable linear combination in this world.

We know that the human brain is made up of grey cells and the human mind is also made up of shades of grey. Mathematics can be used to quantify the human mind and yes, we can calculate more than just 50 shades of grey!

Moral of the story: Embrace mathematics, even if you claim to be a qualitative researcher because beauty lies in integration - the linear combination of qualitative and quantitative research!


Linear Algebra helps us visualize beyond the physical 3 dimensional space through the column-vector concept. Once we are able to visualize multiple dimensions, we may get closer to solving Einstein's dilemma here:


Friday, June 20, 2014

Simple is Robust

Every researcher should treat this as a guiding light :)

Embedded image permalink

If the concept is extremely clear in your mind, you should be able to explain it even to a 6 year old child with ease. This clarity of thought and simplicity should reflect in our writing.
Our research paper should be so simple, yet robust, that the reader should feel the joy of discovery and excitement on turning every page. And it should feel effortless like reading a comic book - an academic, robust comic book.

Wednesday, June 18, 2014

Creating Meaningful Impact in Academia

As an academic researcher, one needs to develop a new theory which is "path breaking". One needs to do disruptive research  in a positively constructive manner.
How can one's contribution be seen to be 'meaningful'?
I was reading a semiotics paper and discovered a beautiful analogy used by Saussure in describing the relationships between words and their meaning.
Saussure talks about a "Chess" metaphor. In a game of chess, moving one piece on the board alters the relationship between all the other pieces on the board.
This metaphor can beautifully be applied to the role of meaningful research in any domain of knowledge. Our theory should be like a new move on the chess board of existing knowledge.  Our move should influence the interrelationships between all other pieces of knowledge in the domain. This influence can be brought by challenging the underlying assumptions in the body of knowledge because the assumptions form the common thread that connects all the pieces together.

Tuesday, June 17, 2014

Research is not an activity. It is a mindset.


I do not consider research to just be an activity or a process. I see it as ‘a way of life’. From the day we are born, we are inquisitive about everything around us. When we hear a loud noise outside, we run towards the window to see what is happening outside. When we see someone upset, we approach her to find out what is wrong. Life always throws mysteries at us that provoke our minds. We are not at peace until we find answers to solve those mysteries. One can draw a parallel to the ‘Laws of Karma’ from Indian spirituality that says that there are many incomplete equations in this world that need to be completed and written-off. Life will give us a chance to solve each of these equations from time to time. We need to be equipped with the spirit of research to solve those mysteries. With research as our way of life, we will be able to make informed decisions at every step and help reduce the level of chaos in today’s world. Well researched decisions are well balanced decisions.

Academic Research is a very interesting field. Throughout our academic life, from school to graduation, we have been reading books written by others. We have been studying theories founded by thinkers over the years. Research is the only way we can create something new and original to the existing knowledge base in this world. The human mind and intellect is capable to finding answers to the deepest unanswered or even unasked questions. If we keenly observe what’s happening around us every day, we will come across many such activities that have no explanation. It would be interesting to find the cause behind such things. Blindly accepting the conventional wisdom is not the right thing to do. According to Galbraith, conventional wisdom is simple, convenient, comfortable and comforting. We need to think out of our comfort zone to find the real answers.

The role of an academic researcher is a very exciting one. I believe that it encompasses numerous other roles that would give me a well-rounded personality. Firstly, it makes me feel like a detective who has been hired to solve a ‘market mystery’. It is my responsibility to collect evidences and deduce insights from the same. Secondly, it makes me feel like a doctor who needs to diagnose the ‘health issues’ with the world of management and provide them with ‘medicinal insights’ that would heal them. And thirdly, it makes me feel like an explorer who is diving into fathoms of the conscious and the unconscious minds of people to bring out pearls of insights to share with the rest of the world. These are three different worlds that come together to create the research world. But the common philosophy that runs through all these roles is of being ‘solution-oriented’.

I recently attended a panel interview where I was asked a question by a gentleman:
“Can you give me an example of a well-researched product that did not do well in India?”
It was a thought-provoking question. As I tried to analyse the question in my mind, I realised that it was actually an invalid question, an oxymoron to be more precise. We need to first define what ‘well-researched’ means. The fact that the product has not done well in the market proves that it was NOT well-researched in the first place! How would you rate research as good or bad? I firmly believe that the ‘mystery-solving’ ability of the research determines its quality. The general belief is that a ‘well-researched’ project is one with a complex research methodology conducted at a large scale with a plethora of jargon, statistics and reports. But the fact is that if the simplest method of research is able to find answers and solve the problem, it will score better than any mammoth project that just ‘beats around the bush’. Sometimes, the journey (methodology) becomes more overbearing than the destination (solution). We must remember that some of the world’s most revolutionary discoveries happened by the most fascinating methodology of nature called ‘serendipity’.

We know that intelligence quotient (IQ) is a hygiene factor for any individual to excel in a knowledge-based environment. But academic research requires a much deeper level of understanding of oneself and of others. Hence, emotional intelligence and empathy is very important to be able to clearly extract insights from the human mind. A researcher needs to possess high emotional quotient (EQ) and be able to step out of the problem to analyze it objectively. She needs to understand her own mind before she can start understanding the consumer’s mind because her own mind will create many biases in her analysis. And finally, she needs to be stung by the “asking bug”. Since childhood we have been encouraged to raise our hand and ask the most stupid questions. We won’t get any answers until we ask questions. Fear of making mistakes stops us from being creative. As Sir Ken Robinson said in his TED talk,
“If you’re not prepared to be wrong, you’ll never come up with anything original… And by the time they get to be adults, most kids have lost that capacity. They have become frightened of being wrong.”
Courage to question the norms, to think of out-of-the-box ideas and to turn them into reality is what is needed to boost the research further into the future. We all have an urge, a need to move forward into the future. But before we move forward, we must learn to look backward and learn from our past. We must learn to be like kids again.

As David Ogilvy says, "The best ideas come as jokes. So, make your thinking as funny as possible."

The day ‘God’ retweeted me


I have always been fascinated by fairy tales. I vividly remember the beautiful story of Cinderella who was transformed into a beautiful princess by her Fairy God Mother, who made all her dreams come true. What could Cinderella have done, if there was no Fairy God Mother?  Every person needs a powerful and magical tool to turn unrealistic dreams into reality. These dreams could involve getting your ‘prince charming’, or, in a more contemporary world, getting an excellent career.
I would like to equate young students and professionals to Cinderella. They have potential and ‘charm’ but the traditional physical barriers of hierarchy seemed to have played the role of their evil step sisters for ages. The budding talents have always found it difficult to get a platform to be heard amidst the abundant talent of experienced experts. Traditionally, the youngsters have had to follow a long and tedious process involving years of baby steps towards climbing the ladder to finally reach the top and be heard. But now, they need not worry. Their Fairy God Mother has arrived.
I come from a generation that has spent its high school on Orkut, and college on Facebook. For me, social media is not ‘just a website’. She is my Fairy God Mother. She helped me discover my long lost childhood friends and my first job. Furthermore, she empowered me with the confidence of building a great future because of the magnificent opportunities she opened up for me in the market research industry. For the past six years I had been using social media just as a ‘past-time’ tool. I used it for personal interaction with friends, and never with strangers. Facebook was the only place where I was actively uploading photos, tagging and commenting with friends and acquaintances. I did not know that I was missing out on a huge chunk of conversations happening outside my small circle of friends online. I had vaguely heard of Twitter and thought that it was just like a ticker on MTV where people followed and gossiped about movie stars. Hence, I had preferred to stay out of Twitter.
In many spiritual scriptures, it is clearly mentioned that the path to reach God is through a “Guru” or a teacher. He acts as a mediator who guides you towards a path to understand and get acquainted with God. For me, ESOMAR played the role of a guru in the avatar of Ray Poynter J!
Last year I was given a life-changing opportunity to attend the ESOMAR APAC Conference in Malaysia where I witnessed the best presentation of my life. It was Ray Poynter’s presentation on the wonders of Twitter and how market researchers can communicate with each other using Twitter. I was amazed at the power of this tool! It was the first time I was introduced to the concept of hash tags like #ESOMAR, #MR, #MRX, et al. The best thing about this was that there were no barriers. One does not need to be in the “inner circle” to be able to tweet with a hash tag. Earlier, I was an ‘outsider’ to the MR community because I was a shy student who did not have any possible means of having a one-to-one conversation with the senior level managers, CEOs of global companies that present at ESOMAR. I feared that whether it would be considered a blasphemy for me to physically barge into a conversation among MR experts. After all, I was just a 21 year old student. And I knew that it would be almost impossible for me to physically attend another international ESOMAR conference until I became a senior researcher which would take at least 3 years time. But I sincerely wished to be a small part of the “inner circle” – to learn and interact with the who’s who of the MR fraternity. As soon as I made this wish, my Fairy God Mother appeared clad in a blue dress with wings (like a tweeting bird), and struck her magic wand. Voila! I had a twitter account @Tanvi_MR J
I started following (stalking is a better word) Ray Poynter and all others who tweeted with the hash tag #MR (which later became #MRX). Initially, I was a silent observer and follower. But gradually, I realized that my fear of blasphemy was impractical. There were many interesting conversations happening on Twitter and all the people were extremely friendly. Hence, I finally plunged into the conversation. My tweets were respected and reciprocated to by the community. This boosted my confidence further. It was only through tweets that I discovered webinars in the topics on market research. Webinars are a boon for students and young researchers who do not get an opportunity to attend conferences in person. I can proudly say that without Twitter, my education in market research would have been incomplete. I tweeted to MR experts and gained their suggestions for my thesis which has now become a masterpiece. Frankly, twitter helped me more that my professors for my thesis!
Another very useful hash tag that has inspired me is #NewMR. It was because of this hash tag that I found out about the New MR Virtual Festival where I got to participate in their poster design competition. I had a wacky idea in my head after playing Farmville on FaceBook. My Fairy God Mother asked me to make a poster on “Choiceville” and upload it on NewMR: (more information can be found here)
My Fairy God Mother struck her magic wand again. I received an overwhelming response on Twitter that made me win the competition. I owe a lot to you, Twitter.
The only thing that saddens me is that nobody in my immediate student peer group has started using Twitter professionally. They feel that it is very “limiting” because of the characters limit. They feel that having a Facebook account is enough because it is ultimately the same kind of interaction in all social media sites. But I would like to make it clear that Twitter has its own unique and powerful magical features that no other site can provide – the power to be heard and to enter the “inner circle”. I would like to request all young researchers and students out there to make use of twitter – but don’t spam! The Fairy God Mother awaits your arrival.

Data Da Vinci – The Artist within the Researcher

We get a lucid understanding of events around us when we see/ hear them in the form of art. From ages, man has communicated information in the form of art, written or spoken. In this age of ‘information’, with dwarfing attention spans, there is a dire need of making it most convenient for people to grasp and understand the information we are trying to give to them.
As one of my clients said blatantly at the end of a bunch of market research presentations, “The audience is getting dumber and dumber everyday!” It made me sit up and think… I suddenly realised that a market researcher has another role to perform – the role of an artist, a dramatist, a story-teller.
As I was sitting through a bunch of presentations made by various research agencies to the client, I was finding it quite cumbersome to stop myself from dozing off. I found my eye balls oscillating from one cell to another in the table on the slide. All I could see were numbers, numbers and numbers filled on the slide. For a moment I was confused whether it was a PowerPoint slide show, or an excel sheet. Slide after slide, it was the same scenario. Although I agree that while presenting the findings of a quantitative study, our slides need to have numbers. But as human beings, our brains have certain limitations to processing a volley of numbers being shot at us. We need to create a map within our brain and make every element fit into it perfectly, only then will everything make sense to us. Otherwise, it all just flies from top of our heads!
As market researchers, we need to show some mercy on our clients. The human mind needs to be convinced in order to buy into any idea. After all, the ultimate end product that a researcher is giving to the client is an ‘idea’ or an ‘insight’ emerging from the data. And the manner in which the data/ idea is presented to the client will make a huge difference to its acceptance.
We must learn from the great artists about the secret of their success. As Picasso puts across very lucidly, “Art is the elimination of the unnecessary.” Similarly, our market research presentation should be considered as a form of art. While creating a presentation deck, we must look at it like our masterpiece and make it crisp and yet attention grabbing.
Market Research is done to deep-dive into the consumers’ mind and extract pearls of insight. Hence, the entire research findings presentation should focus around the consumer. We must understand companies from the consumer’s perspective instead of researching consumers from the company’s perspective. Each slide on our presentation deck should ideally look like the consumer speaking directly to the client instead of a third party (the research agency!) speaking on behalf of the consumer. This may sound absurd, but it is possible if the creator of the presentation can put herself in the shoes of the consumer and “feel” like the consumer while creating and presenting the deck. It requires empathy and an inner journey while looking at the data. After all, the subject of all our analysis, at the end of the day, is a human. Just like we tell stories about our friends and family members to each other, in the same way we need to narrate stories about human beings, whom we refer to as ‘consumers’. We should not use too much jargon because it makes one feel like we are describing a mechanical process like photosynthesis instead of describing the psyche and behavior of a human being. The narration should emerge from the heart. The language used in the presentation can also be made conversational and in first person as if the consumer has herself made the slides! For example, instead of writing “The consumers understood the context of the advertisement” in the presentation, we can just write “I understood the ad” in a call out. It would give the client a sense of being one step closer to the consumer while looking at your deck.
The use of visual elements in the deck also plays a very important role in keeping the audience attentive and interested. Especially, when presenting complicated numbers, it is better to use visual elements like Venn diagrams, mind maps and flow charts instead of plain tables. On an average, the time given to the audience in between 2 slides does not last for more than a minute. The human mind is capable of processing visual data much faster than textual data. Hence, if we want the audience to pick up more meat from our deck at the end of the day, we must use more visual cues.
As Leonardo Da Vinci says, ““Simplicity is the ultimate sophistication”. There is always a limit to the amount of “jazzing up” one can do in a presentation. We do not want to crowd the slides with too many visuals and an overload of data. Being crisp, simple and to the point are the traits of Data Da Vinci!

Time to the face the sun

Pack your bags. Get on the road. Sweat it out on the field.
“After sleeping through a hundred million centuries we have finally opened our eyes on a sumptuous planet, sparkling with colour, bountiful with life. Within decades, we must close our eyes again. Isn’t it a noble, an enlightened way of spending our brief time in the sun, to work at understanding the universe and how we have come to wake up in it?” – Richard Dawkins
Every human being on this planet has an explorer within themselves. We need to explore, open closed doors to find answers to our questions. Those who do not make an attempt to get out in the sun and explore, they will never find the true answers they seek. This would apply to every human, every marketer and of course, to every market researcher.
It is said that a marketer should try to get as close and personal to their consumers as possible instead of sitting in their ivory tower. However, this task is usually passed on to the researcher. But the researcher dwells in their own cosy ivory tower. The researchers need to be close to their consumers. The researcher’s consumers are their respondents. The respondents ‘consume’ the survey experience and if the survey questionnaire is created in the air-conditioned ivory tower of the researcher’s office, there may be high chances of things going awry.
We all know that the source of revenue for all research comes from the client and hence we need to delight the marketer who is our ‘customer’. But shouldn’t researchers also look at the other side of the same coin and realise that their true ‘consumers’ are their respondents?
A researcher has to ‘sell’ 2 products to 2 types of consumers:
  1. The research findings to the client, in exchange of their money
  2. The ‘survey experience’ to the respondent , in exchange of their time
The quality of the first product mentioned above depends solely on the quality of the second product. Data lies at the heart of insights and the respondent lies at the heart of the data.
Hence, it is as important for the researcher to be as close to respondents as it is to the client. Making a mind blowing presentation to the client is important, but it is more important to have an excellent well-planned survey experience for your respondents. The biggest hurdle between you and the robust questionnaire is your personal bias and your blind faith on your own knowledge and experience. In the words of Charles Thompson-
“Do anything to prevent yourself from becoming a prisoner of your knowledge, experience, and current view of the world… Be an explorer.”
Hence, it becomes a paramount duty of the researcher to visit field work for each of their studies. The field is the best place to learn MR and to enhance one’s knowledge and experience!
In India, a major chunk of quantitative research happens through PAPI with interviewers going door-to-door requesting for respondent’s time. Most studies in India have their sample spread across different geographical zones and languages. Doing a research study covering the whole country of India is equivalent to doing a multi-country study! This makes the challenge greater for the researcher to design a one-size-fits-all questionnaire keeping in mind the cultural and attitudinal diversity of the different regions. One word in one language could mean something completely absurd in another language! If the researcher personally does not keep an eye out on field, there will be many glitches that will go unnoticed and if we realise these glitches after we receive the final data, it would be too late to rectify them. The researcher should adopt the mantra – Better Safe than Sorry!
Pilot tests should be a part of every study. However, in many cases there is dearth of time to insert a pilot. Hence, keeping an eye on field-work at least during the initial phase of the research becomes mandatory. It not only works as a quality control device, it also provides the researcher a first-hand “feel” of the respondents’ views and brings her closer to the hidden insights when may not be revealed just by looking at the rows and columns of the excel sheet data that we receive in our ivory towers. We must have encountered weird-looking and contradictory data many times in our studies. We end up blaming the data quality for it. We are left with many unanswered questions and loose ends that the rows and columns of numbers are not able to answer. If the researcher goes out and meets the respondent face-to-face, keeps an eye on how each question is being administered by the interviewer and how each answer is being recorded, she can easily plug in the missing pieces of the jigsaw puzzle. Getting to know the pulse of the consumers at their homes, being an explorer is what a true researcher should do. If we brainstorm and dive through the excel sheets within our offices, we will surely find a light bulb of an idea. But we should realise that the ‘sun’ is out there which glows brighter than a million light bulbs!
“Following the light of the sun, we left the Old World.” – Christopher Columbus
“Three things cannot be long hidden: the sun, the moon, and the truth.” – Buddha

Let’s Play a Game of Jigsaw Puzzle

Putting Together Pieces of Data


I loved putting together jigsaw puzzles as a child, searching for pieces that fit together. The greatest satisfaction emerged from the last piece, which always used to be a centre piece in the puzzle. When all the pieces got together, it would be my masterpiece. I guess this would have been a favorite game for many other children who, like me, grew up to become market researchers!
We encounter many occasions where the data before us fails to explain the ‘complete story’. We scratch our heads and sometimes bang it on the table to find answers to solve the puzzle before us but it all seems difficult and unfair. We end up blaming the data quality when we cannot explain the data. But does the fault really lie with the data? Or does it lie with the researcher’s path of analysis?
“A good puzzle, it’s a fair thing. Nobody is lying. It’s very clear, and the problem depends just on you.” ~Erno Rubik
The fieldwork that is carried out in the study gives you a certain amount of data. But who says that you are not allowed to look beyond your excel tables or transcripts? It’s not that your data is your spouse and you are cheating on it! Your data is like a friend, you can have more than one. In fact, in most cases, you would need more ‘data friends’ to help you complete your puzzle. The data that we receive after fieldwork is like somebody gives us a jigsaw puzzle, and we’re not given all of the pieces. We need to find the other pieces to crack the puzzle.
We can also look at it from the perspective of an explorer who needs to find the exact location of a ship in the sea. The method of ‘triangulation’ is used to solve this puzzle as follows:
”Triangulation can be used to calculate the coordinates and distance from the shore to the ship. The observer at A measures the angle α between the shore and the ship, and the observer at B does likewise for β . With the length l or the coordinates of A and B known, then the law of sines can be applied to find the coordinates of the ship at C and the distance d”
Hence, the integration of multiple data becomes mandatory to get a sharp focus on the solution.
“Reading widely and getting as much information as possible exposes you to small pieces of a giant jigsaw puzzle and even if the information is not 100% clear at the time, by shuffling it around in your mind, ideas eventually come to you.”~ James Portman
As Aristotle says, “The whole is greater than the sum of its parts.” When we integrate multiple sources of data a,b and c, it is not just a+b+c. It is in fact, a*b*c where the insights emerge multipled. There is a synergy that happens when we put 2 or more pieces of data in proximity to one another. We derive more insights instead of looking at them separately.
This phenomenon can be explained by the operational principle of gestalt psychology which says, “the brain is holistic, parallel, and analog, with self-organising tendencies.” Gestalt psychologists stipulate that perception is the product of complex interactions among various stimuli. Our brain is wired to perceive more than we actually see before us. Gestalt can be proved by these practical examples given below, where the human mind has the tendency to “complete” the puzzle when provided with relevant pieces:
This is called Reification, “the constructive or generative aspect of perception, by which the experienced perception contains more explicit spatial information than the sensory stimulus on which it is based”. In the figure above, one can deduce that figure A is a triangle and figure B&D are worms.
Hence, it becomes more important for the same person to look at all the sources of data instead of dividing the analysis into parts and outsourcing it to different teams. For example, when there is a project that involves both a quantitative as well as a qualitative phase, it is usually carried out by 2 teams that work more or less independently. In order to achieve gestalt, the entire thinking process should be integrated. It is not just about integrating the research; it is also about integrating the researcher. If the same person is involved in all phases, she will get a holistic picture and she will be able to create a complete “world” inside her mind.
“There are no extra pieces in the universe. Everyone is here because he or she has a place to fill, and every piece must fit itself into the big jigsaw puzzle.”
~Deepak Chopra